
BLOG ·
How Truckload Fuel Surcharges Actually Work (and Where Carriers Lose Money)
A fuel surcharge is supposed to make fuel a pass-through. In practice, the schedule decides who eats the swings. This is the manual we wish every truckload pricing analyst had: the three schedule types, the real math on a real lane, and the gaps that quietly cost carriers money.
Two carriers haul the same lane for the same shipper at the same all-in rate. By the end of the contract year, one made money on fuel and one lost it. Diesel did the same thing to both of them. The difference was the fuel surcharge schedule, and neither carrier read it closely at bid time.
This post is a working manual for truckload fuel surcharges: what the schedule types are, how to read them, and where the money actually moves. We price truckload RFPs for carriers every week, and this is the same math we run on every one of them. Every number in it is real. Diesel prices are the U.S. Energy Information Administration's weekly on-highway series, current through the August 17, 2026 print, and the worked examples run on a real 700-mile lane shape from a live truckload RFP.
What a fuel surcharge is supposed to do
The idea is clean. The linehaul rate pays for the truck, the driver, and the margin. The fuel surcharge (FSC) floats with the price of diesel, so neither side has to speculate on fuel for a year. When diesel rises, the surcharge rises; when it falls, the shipper keeps the savings. Fuel becomes a pass-through and the bid becomes a bet on operations, not on OPEC.
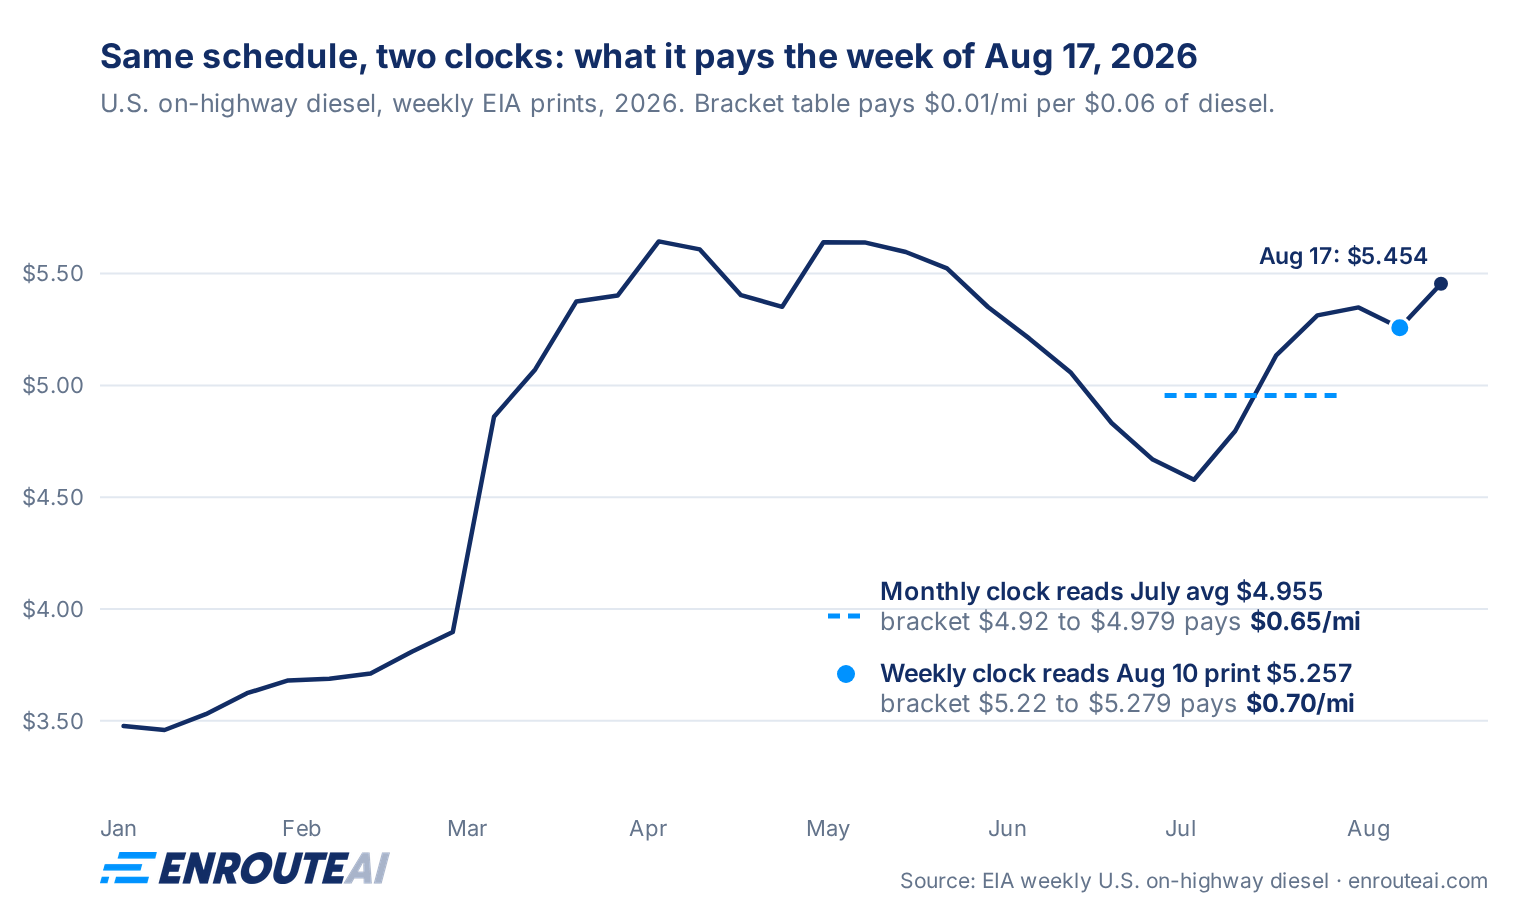
Almost every schedule in truckload keys off the same index: the DOE national average, which is the EIA's weekly U.S. on-highway diesel price, published every Monday. On August 17, 2026 it printed $5.454 a gallon.
That is where the clean idea ends, because "floats with diesel" hides three choices the shipper made for you: the shape of the schedule, the clock it reads, and the index region. Each one moves real money.
The three kinds of schedules
| Type | How it pays | Where you see it |
|---|---|---|
| DOE bracket table | Diesel price range maps to a flat $/mile | Most large shippers and digital brokers |
| Percent of linehaul | FSC is a % applied to your submitted linehaul | Some shippers, common in LTL heritage programs |
| Breakthrough / actual burn | Reimburses fuel actually consumed on the route | A minority of sophisticated shippers |
DOE bracket tables are the workhorse. A large digital freight broker's current published schedule starts at $0.13 per mile when diesel is between $1.80 and $1.859, and steps up one cent per mile for every six-cent bracket. An excerpt:
| DOE national average ($/gal) | FSC ($/mile) |
|---|---|
| 4.86 to 4.919 | 0.64 |
| 4.92 to 4.979 | 0.65 |
| 4.98 to 5.039 | 0.66 |
| 5.04 to 5.099 | 0.67 |
| 5.10 to 5.159 | 0.68 |
| 5.16 to 5.219 | 0.69 |
| 5.22 to 5.279 | 0.70 |
Find the row your diesel number lands in, multiply by the miles, done. Two details matter more than they look. First, bracket boundaries: $5.039 and $5.04 are one row apart and worth a cent a mile, so land the exact number, not a rounded one. Second, the ceiling: printed tables end (this one effectively tops out in the $5.60s), and the fine print usually says something like "continue with the same format of increase." If diesel runs past the table, that sentence is your schedule.
Where do these tables come from? Almost all of them are the old owner-operator formula frozen into rows: (DOE price − peg) ÷ assumed mpg, where the peg is the diesel price the base linehaul is assumed to cover. Run that formula with a peg near a dollar and 6 mpg and you reproduce this exact table, one-cent step and all. Which means every bracket table silently assumes a fuel economy for your fleet, a detail that matters more than it looks and that we will come back to.
Percent of linehaul pays fuel as a percentage of whatever linehaul you submitted. The math consequence is easy to miss: your fuel compensation now scales with your rate, not with your miles. Two lanes with identical miles and identical fuel burn get different fuel dollars if their linehauls differ. It also changes the bid-time math, which we will get to.
Breakthrough-style programs reimburse the fuel actually burned on the route, using the truck's real economy and route-level prices. It is the theoretically clean answer, and it is rare, because it requires data most shippers do not want to manage. If you are offered one, the question shifts from "what does the table pay" to "whose fuel economy number are we using."
The two clocks
Before any math, find the schedule's clock. Bracket tables read the DOE index one of two ways:
- Weekly: this week's FSC comes from the prior week's Monday print.
- Monthly: the whole month runs on the prior month's average.
Most weeks the difference is noise. In a moving market it is not, and the market is moving right now. The national print climbed from $4.578 on July 6 to $5.454 on August 17, an 88-cent run in six weeks.
Read the same broker table above on both clocks this week:
- Weekly clock: prior-week print $5.257, bracket $5.22 to $5.279, $0.70 a mile.
- Monthly clock: July average $4.955, bracket $4.92 to $4.979, $0.65 a mile.
Same truck, same diesel, same table: five cents a mile apart, purely from the clock. On the 700-mile lane below, that is $35.00 a load. At three loads a week it is roughly $5,500 a year, on one lane, decided by a line in the schedule nobody negotiates. And the longer the haul, the more the schedule matters: every cent per mile of fuel gap is $7.00 a load here, against $2.87 on a short 287-mile regional run.
The clock also decides who eats a swing. A monthly schedule lags: when diesel spikes, you run up to five weeks of the new price on the old average, and when it falls, the shipper does. Weekly schedules track tighter in both directions. Neither is "better." One of them just needs to be priced in, and the time to do it is bid time.
Worked example: pricing a lane against a bracket table
The lane: Chicago, IL to Atlanta, GA, 700 miles, three loads a week, the shape of a real lane in a truckload RFP on our desk this month. Say your target linehaul on it is $3.00 a mile.
Step through the shipper's schedule (monthly clock, table above):
- July 2026 national average: $4.955 a gallon.
- Bracket: $4.92 to $4.979, so $0.65 a mile.
- FSC per load: 0.65 × 700 = $455.00.
- All-in as the shipper sees it: (3.00 + 0.65) × 700 = $2,555.00 a load.
That is the easy half. The half that decides whether the lane makes money is next.
The gap: your fuel cost vs their schedule
The schedule pays what the table says. Your trucks burn what they burn. Those are two different numbers, and the difference lands on the linehaul whether you priced it or not.
Put a number on your side first. At the industry-average 7.4 miles per gallon (ATRI's 2025 operational costs figure) and the current $5.454 print, the tractor's fuel cost is:
5.454 / 7.4 = $0.74 a mileThe schedule above pays $0.65. The nine-cent shortfall does not disappear; it comes out of your linehaul. Sophisticated pricing teams make that transfer explicit with a keep-whole equation:
submit linehaul = target all-in − shipper's FSCFor the lane: target all-in is 3.00 + 0.74 = $3.74 a mile. Submit 3.74 − 0.65 = $3.09 a mile, which is $2,163.00 a load. Self-check: 2,163.00 + 455.00 = $2,618.00 = 3.74 × 700. The lane pays your true cost of fuel, and the nine cents rode in on the linehaul, where it belongs. Nine cents a mile sounds small; on this lane it is $63.00 a load and about $9,800 a year, and it was invisible until you ran your own number against theirs.
For a percent-of-linehaul schedule the same logic divides instead of subtracts, because the fuel payment depends on the number you submit:
submit linehaul = target all-in / (1 + FSC%)At an 18 percent FSC, the same lane submits 3.74 / 1.18 = $3.17 a mile. Subtracting like a bracket table here silently misprices the lane. Getting this fork wrong is one of the most common quiet errors in carrier bids.
Now the part that makes this a position, not a calculation: the gap moves. Six weeks before that $5.454 print, diesel was $4.578. At $4.578 your cost is $0.62 a mile and the same table pays $0.59: a three-cent gap. Today it is nine. A schedule with wide brackets, a stale clock, or a low ceiling behaves fine at bid time and bleeds when the market runs, and you hold that position for the contract year. Across the bids we priced this summer, the pad ran from six cents to twenty-five cents a mile: same market, same index, different schedules. Reading the schedule at bid time is how you decide what the position is worth.
Why raw benchmark rates mislead here
This is also why lifting a rate straight off a load board benchmark and pasting it into a bid goes wrong. Composite benchmarks are built mostly from broker-reported spot moves, quoted all-in. A broker can treat fuel as a pass-through inside an all-in number, so the split between linehaul and fuel barely matters to the composite. It matters entirely to you, because your contract pays a linehaul you submit plus a fuel schedule you now know how to read.
Two carriers copying the same $2.80 all-in benchmark into two different shippers' bids are submitting two different real rates. The benchmark is still useful as a market band, but only after you fuel-normalize it: strip your shipper's FSC out, compare linehaul to linehaul, then decide where to sit.
Apples to apples: this year's bid vs last year's
The same normalization solves a problem every incumbent carrier hits at renewal. The shipper says rates need to come down five percent. Down from what? Last year you submitted $3.09 linehaul when the schedule paid $0.65 in fuel. This year the same math might have the schedule paying $0.59. If you compare submitted linehauls raw, you are comparing two different fuel worlds and negotiating against noise.
Normalize both to all-in at a common diesel reference before comparing:
| Submitted LH | FSC at bid time | All-in | |
|---|---|---|---|
| Last year | 3.09 | 0.65 | 3.74 |
| This year's draft | 3.15 | 0.59 | 3.74 |
Raw linehaul says you went up two percent. Fuel-normalized, you are flat. That is the honest comparison, for the shipper's procurement team and for your own scorecard.
Two places the sophisticated money hides
Reefer. A refrigerated trailer burns diesel twice: the tractor and the reefer unit, and the unit's burn is driven by time and setpoint, not miles. Public spec and test data put a fresh (34 to 38°F) load around 15 percent more total fuel than dry van, and frozen around 26 percent more, because deep-cold setpoints force the unit to run continuously. A dry-van-shaped per-mile schedule structurally undercompensates both, and frozen worst. In our experience, the reefer carriers that got fuel right, setpoint and cargo type included, are the ones that made money through the freight recession while their competitors hauled frozen loads on dry-van surcharges. We are working on a full cost model for a follow-up post.
Where your lanes actually run. Nearly every schedule reads the national DOE average. Diesel is not national. On the August 17 print, California diesel was $6.785 against the national $5.454, a $1.33-a-gallon gap, which at 7.4 mpg is about $0.18 a mile the national table never sees. If your network is heavy in a high-cost region, a national schedule quietly under-recovers you on every mile there; if it is heavy in a cheap-diesel region, the same table overpays. Shippers rarely regionalize the index, which makes this a real, priceable edge for a carrier who knows their lane mix. Also a topic that deserves its own post.
Checklist: read the schedule before you bid
- Model: bracket table, percent of linehaul, or actual-burn? This decides whether you subtract or divide.
- Clock: prior-week print or prior-month average? Price the lag.
- Peg and brackets: what diesel price does the schedule assume your linehaul covers, and how wide are the brackets? Wide brackets mean bigger jumps at the boundaries.
- Ceiling: where does the printed table end, and what does the fine print say happens above it?
- Index region: national DOE or a regional average? Compare it to where your miles actually run.
- Equipment: does the schedule acknowledge reefer burn at all?
- Your side of the math: know your own $/mile fuel cost at today's diesel before you look at theirs.
- Renewals: fuel-normalize before comparing anything to last year.
The closing note
None of this math is secret. It is a lookup, a subtraction, and a division, and on one lane it takes five minutes. A real RFP is 300 lanes, or 3,000, each against its own schedule, clock, and fuel model, due Friday. That is the version of the problem EnrouteAI is built for: it carries each bid's fuel program (per-mile table, percent, or fixed), prices every lane from your own strategy and history, and shows a fuel-normalized market band beside each rate so the benchmark trap above never makes it into your file. If fuel surcharge math is where your bids leak margin, that is worth a look.
FAQ
How is a truckload fuel surcharge calculated?
Most schedules map the DOE national average diesel price (the EIA's weekly Monday print) to a flat cents-per-mile amount through a bracket table, and pay that on top of the linehaul. A minority pay a percentage of the submitted linehaul instead, and a few reimburse actual burn.
What diesel price does a fuel surcharge use?
Almost always the EIA's U.S. on-highway diesel average, read either as the prior week's print or the prior month's average. The choice of clock can move the surcharge several cents a mile in a fast market.
Is the fuel surcharge negotiable in an RFP?
The schedule itself usually is not; shippers run one program for all carriers. What you control is the linehaul you submit against it. The keep-whole math above is how you make the schedule's gaps show up in your linehaul instead of your margin.
What fuel economy does a fuel surcharge schedule assume?
Most bracket tables are built on roughly 6 miles per gallon, the traditional industry figure. ATRI's 2025 average is 7.4, and newer aero tractors report 8 or better. If your fleet beats the schedule's assumed mpg, the surcharge overpays you on fuel as prices rise; if you run older iron below it, the schedule undercompensates you, and that gap belongs in your linehaul too. Battery-electric tractors like the Tesla Semi and the Freightliner eCascadia break the formula entirely: they burn no diesel at all, yet today's schedules still pay a diesel-indexed surcharge. Expect EV-specific fuel programs to become a bid-time question as those fleets grow.
Why is my reefer fuel surcharge too low?
Most schedules are built on tractor fuel economy only. A reefer unit burns diesel by the hour, not the mile, and frozen setpoints run it continuously, so per-mile schedules undercompensate refrigerated equipment by design.