
BLOG ·
Apples to Apples: Comparing Freight Rates When Fuel Will Not Sit Still
Two comparisons decide most pricing conversations: what you quoted this shipper last year against what you are quoting now, and what you quote one shipper against what you quote another. Neither is apples to apples until fuel comes out of it. Between the last bid season and this one diesel moved $1.91 a gallon, and every schedule read it differently.
Every pricing conversation a carrier has comes down to one of two comparisons.
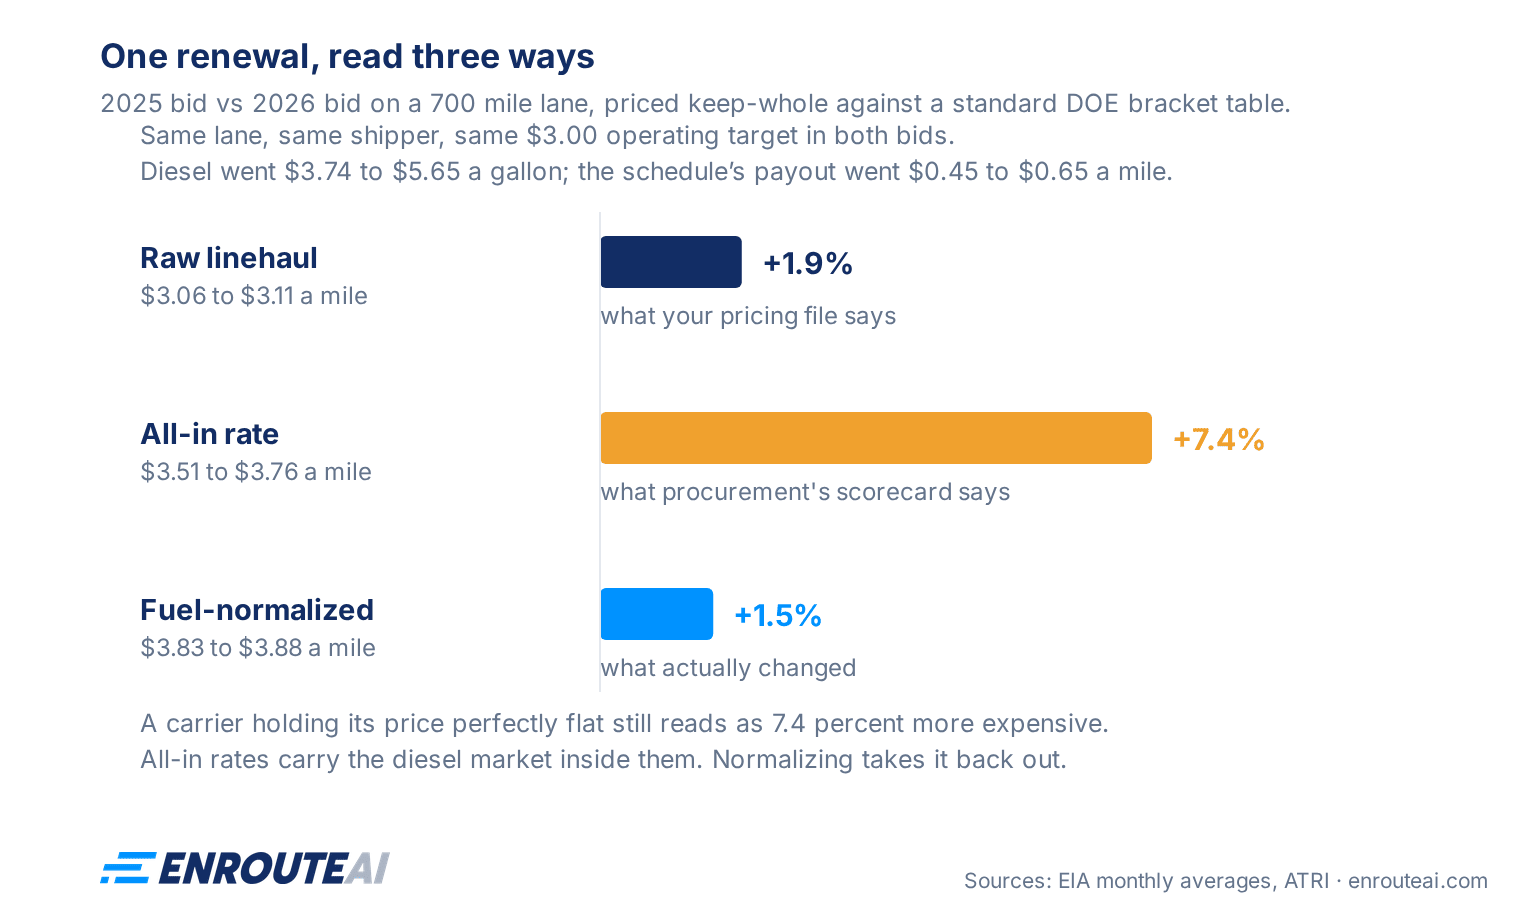
Same customer, two years. Renewal season, incumbent lane, and the email says rates need to come down 5 percent. Down from what? Last year you submitted $3.06 a mile of linehaul. This year your file says $3.11. That reads as an increase of 1.9 percent, while the shipper's scorecard says your all-in rate went up 7.4 percent. Both numbers are calculated correctly from the same bid.
Two customers, same week. You quote shipper A $3.11 a mile and shipper B $3.03 for the same 700 mile shape with the same truck and the same cost. It looks like you gave B an 8 cent discount. You did not. You gave them identical rates, and the difference is entirely in how their two fuel schedules read the same diesel price.
Neither comparison is apples to apples until fuel is out of it. This post is the normalization half of the fuel surcharge manual: how to take fuel out of both comparisons so what is left is the thing you are actually negotiating.
Three numbers move, and only one of them is your rate
- Your submitted linehaul. The number you control.
- What the fuel schedule pays. Set by the table and the diesel market, not by either party.
- What fuel actually costs you. Set by the market and your equipment.
Between the 2025 and 2026 bid seasons, the last two moved hard. The national on-highway diesel average, published weekly by the EIA, was $3.74 in August 2025 and $5.65 on the August 24, 2026 print. On a standard bracket table (the same one from the manual, which reads the prior month's average), the payout went from $0.45 a mile to $0.65. Your actual fuel cost at 7.4 mpg went from $0.51 to $0.76.
Every rate conversation this season is happening on top of those two moves, and most of them are being conducted in raw numbers that still contain them.
Case one: the same shipper, a year apart
One lane, same shipper, same schedule, same operating target of $3.00 a mile both years. Keep-whole pricing both times, straight out of the manual: submit linehaul equals target all-in minus what the schedule pays.
| Last year (Aug 2025) | This year (Aug 2026) | |
|---|---|---|
| Diesel, monthly average feeding the table | $3.779 | $4.955 |
| Schedule pays | $0.45/mi | $0.65/mi |
| Your fuel cost at 7.4 mpg (ATRI fleet average) | $0.506/mi | $0.764/mi |
| Operating target | $3.00/mi | $3.00/mi |
| Target all-in | $3.506/mi | $3.764/mi |
| Submitted linehaul | $3.06/mi | $3.11/mi |
Now read the same table three ways, which is what actually happens in the meeting:
- Raw linehaul: 3.06 to 3.11, up 1.9 percent. Your pricing analyst's view.
- All-in rate: 3.506 to 3.764, up 7.4 percent. Procurement's view, and the one in most shipper scorecards.
- Fuel-normalized: restate both years at one diesel price. At the August 24 print of $5.652 the table pays $0.77, so last year's bid is 3.06 + 0.77 = $3.83 and this year's is 3.11 + 0.77 = $3.88, up 1.5 percent.
Nobody lied. The 7.4 percent is fuel arriving through a schedule both parties agreed to. The real change in what you charge to move the freight is about a percent and a half, and until somebody normalizes, that fact has no way to enter the conversation.
The method, in four steps
- Pick one reference diesel price and write it down. The current weekly EIA print is the best choice, because both sides can look it up and neither side picked it. A trailing 12-month average also works and is steadier. What matters is that it is the same number for both sides of the comparison.
- Recompute what each schedule pays at that reference price. Not what it paid at the time. What it would pay today.
- Add each bid's submitted linehaul to its own recomputed surcharge. That is the fuel-normalized all-in.
- Compare those two numbers, and nothing else.
A shortcut worth knowing: if the fuel schedule did not change between the two bids, comparing submitted linehauls is already normalized. The surcharge term is identical on both sides and cancels. That is why the linehaul comparison above (+1.9 percent) is close to the normalized one (+1.5 percent), off only by bracket rounding.
Which tells you exactly where to look: the shortcut breaks the moment the shipper changes the program, and shippers change the program more often than carriers notice.
When the schedule changed and nobody mentioned it
Three changes to watch for between bid cycles. Each one shows up as your rate increase if you do not catch it.
The peg moved. Bracket tables are (diesel price minus a peg) divided by an assumed mpg. Move the peg from $1.05 to $1.25 and the table pays $0.62 instead of $0.65 at the same diesel price. To stay whole you submit 3 cents more linehaul, and the raw comparison now says you raised your rate 1 percent when you did not change your price at all.
The mpg divisor moved. Same effect, different lever, usually presented as modernizing the table to reflect newer equipment. A divisor moving from 6.0 to 6.5 cuts the payout by about 8 percent at the same diesel price.
The clock moved. Weekly to monthly, or prior week to same week. In a rising market a monthly clock pays less than a weekly one; this week the two clocks read $4.955 and $5.454, which is 8 cents a mile apart on the same table. Nothing about your cost changed.
The move in all three cases is the same. Recompute both years' schedules at the one reference price, and the change lands where it belongs: as a change in what the shipper's program pays, quantified, in cents per mile, in a table you can put in front of them. That is a very different meeting from "our costs went up."
Percent-of-linehaul programs deserve their own warning. There the surcharge scales with your rate, so it never cancels. Divide instead of subtract: submitted linehaul equals target all-in divided by (1 plus the percentage). If the shipper drops the percentage from 18 to 15 between bids, holding the same all-in requires submitting 2.6 percent more linehaul. Read raw, that is a rate increase. It is not; it is the same money moving from their column to yours.
Case two: two shippers, the same week
The comparison inside your own file is the one that gets skipped, and it is the one that quietly decides which customers look profitable on a rate report.
Same 700 mile shape, same truck, same $3.764 all-in target. Two shippers running the same bracket table on different clocks, a monthly one reading July's average and a weekly one reading last Monday's print:
| Shipper A (monthly clock) | Shipper B (weekly clock) | |
|---|---|---|
| What the schedule reads | July average, $4.955 | Aug 17 print, $5.454 |
| Schedule pays | $0.65/mi | $0.73/mi |
| Submitted linehaul, keep-whole | $3.11 | $3.03 |
| All-in to you | $3.76 | $3.76 |
Eight cents of daylight between two linehauls that are the same price. Anyone reading the linehaul column concludes you are cheaper for B, and if that column feeds a customer profitability report, B looks like the discount account and A looks like the rich one. They are the same account.
Two rules, and they are not the same rule:
- Same customer across years, same schedule: compare linehaul to linehaul. The surcharge cancels.
- Different customers, different schedules: compare all-in at one diesel price, computed through each shipper's own schedule. The linehauls are not comparable, because each one was built against a different fuel program.
The second rule is also how you answer the question every pricing desk gets in a market like this one: which of our customers are actually paying us for fuel? Restate every account's all-in at the same reference price and the answer stops being an opinion.
The mix trap, which is bigger than the fuel trap
Fuel is the trap everyone eventually finds. Mix is the one that survives normalization, and it moves bigger numbers.
Three lanes, unchanged shipper, and every lane's rate either rose or held:
| Lane | Miles | Loads/yr | Last year $/mi | This year $/mi |
|---|---|---|---|---|
| A | 700 | 156 | 3.06 | 3.11 |
| B | 300 | 260 | 3.55 | 3.62 |
| C | 1,200 | 52 | 2.62 | 2.60 |
Weighted by miles, last year averages $3.103 and this year $3.142, up 1.3 percent. Straightforward.
Now change nothing about the rates, and let the shipper double the volume on lane C, the cheap long-haul one, because their network shifted. Re-weight and this year averages $3.034, which reads as down 2.2 percent against last year. Same rates. Every single lane priced flat or up. The award reads as a decrease.
It works the other way just as easily, and that version is the one that gets a carrier a hostile scorecard for a rate increase they did not take.
Two rules:
- Weight by the same volumes on both sides. Use last year's actual volumes for both, or the RFP's forecast volumes for both. Just not one of each.
- Weight by miles, not by loads, unless every lane is the same length. A 300 mile lane and a 1,200 mile lane are not one vote each.
And the simple average of the three lane rates, which is what gets pasted into a lot of summary decks, says up 1.1 percent in the base case: close enough to look right, and wrong for a reason that will not stay small on a 300 lane award.
Comparing to the market, not just to yourself
The same normalization is what makes a benchmark usable. Load board composite rates are quoted all-in and built mostly from broker-reported spot moves, so a benchmark that moved 7 percent between years may have moved entirely on diesel. Strip the implied fuel out of both years of the benchmark before you compare it to your linehaul, or you will negotiate against a number that is measuring the fuel market you are already being paid for separately. There is more on why raw benchmarks mislead in the manual.
Checklist for a rate comparison
- Get the schedule, not just the rates. Peg, divisor, clock, brackets, ceiling, for both sides of whatever you are comparing.
- Diff the two schedules. Any difference is worth cents a mile and belongs in the conversation before the rates do.
- Pick one reference diesel price and use it on both sides.
- Recompute each schedule's payout at that price.
- Same customer, same schedule: compare linehaul. Different schedules: compare all-in at the reference price.
- Never compare all-in to all-in across a moving fuel market without normalizing. That is the 7.4 percent that is not yours.
- Hold volumes constant when you aggregate, and weight by miles.
- Check whether the regional picture moved. If the schedule is national and your lane mix shifted toward high-cost-diesel regions, your fuel gap changed even though the schedule did not. See the regional post.
- Bring the normalized table to the meeting. Procurement teams are not hostile to this math; most of them have never been shown it, and it makes your number auditable.
The closing note
On one lane, this is four lines of arithmetic. On a renewal file it is 300 lanes against two schedules, two diesel worlds, and a volume forecast that changed, with a Friday deadline and a shipper who already circulated a number. EnrouteAI does that comparison lane by lane: last year's award and this year's draft restated at one diesel price, on constant volumes, with a fuel-normalized market band beside each rate, so what you take into the negotiation is what actually changed.
A tool for this, in preview
We are building a fuel surcharge simulator that runs this arithmetic for you: enter two schedules, set one reference diesel price, and it restates both bids on the same basis so the linehaul comparison is clean. It is in internal preview right now. If you want early access, ask for it here.
Sources
- EIA, weekly U.S. on-highway diesel prices. Every diesel figure here is from that series, including the monthly averages, which are the simple mean of the weekly prints in the month
- ATRI, Operational Costs of Trucking, for the 7.4 mpg fleet average used in the cost line
FAQ
How do I compare freight rates year over year when fuel changed?
Restate both years at one diesel reference price. Recompute what each year's fuel schedule would pay at that price, add it to each year's submitted linehaul, and compare those two totals. If the schedule was identical both years, comparing submitted linehauls directly gives the same answer, because the surcharge term cancels.
What is a fuel-normalized rate?
An all-in rate restated as if diesel were at one fixed reference price, so that changes in the diesel market do not show up as changes in your pricing. It is the only comparison that isolates what a carrier actually charges to move freight.
Should I compare linehaul or all-in rates?
Linehaul when it is the same shipper on an unchanged schedule, because the fuel term cancels. All-in, restated at one diesel price, when the schedules differ, which includes comparing two customers to each other. All-in comparisons across years mix your pricing with the diesel market: between the 2025 and 2026 bid seasons a carrier holding its price perfectly flat still shows an all-in increase of about 7.4 percent purely from fuel.
How much did the fuel surcharge change between 2025 and 2026?
On a standard DOE bracket table, the payout went from about $0.45 a mile (July 2025 monthly average, $3.78 diesel) to about $0.65 a mile (July 2026 average, $4.96). Actual fuel cost at 7.4 mpg went from $0.51 to $0.76 a mile over the same period, and the national diesel average moved $1.91 a gallon.
Why do two customers show different rates for the same lane?
Usually the fuel schedule, not the price. A shipper whose table reads last month's diesel pays less in a rising market than one reading last week's, so keep-whole pricing submits a higher linehaul to the first and a lower one to the second for exactly the same all-in revenue. Compare the all-in at one diesel price before concluding that one customer is getting a discount.
Why does my award look cheaper this year when every rate went up?
Almost always mix. If volume shifts toward long-haul or otherwise lower per-mile lanes, the weighted average falls even with every individual rate flat or higher. Hold volumes constant across both years and weight by miles, not by load count.