
BLOG ·
The Regional Fuel Gap: California Diesel Runs $1.39 a Gallon Above the National DOE Average Your Surcharge Reads
Fuel surcharge schedules assume diesel has one price. It does not. On the August 24, 2026 print a gallon cost $5.35 in the Lower Atlantic and $7.04 in California, and the schedule paid both trucks the same. That spread is 23 cents a mile of real money, and which side of it you are on is decided by where your lanes run, not by how well you operate.
On August 24, 2026, a gallon of on-highway diesel cost $5.350 in the Lower Atlantic and $7.040 in California. Same week, same fuel, $1.69 a gallon apart.
Your fuel surcharge schedule did not notice. Nearly every truckload program in the country reads one number, the national average, which printed $5.652 that week. The California truck was under-recovered by 19 cents a mile. The Lower Atlantic truck was over-recovered by 4 cents. Neither of them did anything differently.
This is the regional half of the fuel surcharge manual. What the spread looks like right now, why California has been pulling away from the national average for six years, and how to price a national schedule when your miles are not national.
One index, nine prices
The EIA publishes the weekly on-highway diesel average for the country and for each refining region. Almost every fuel surcharge table in truckload reads the first number and ignores the other eight. Here is the August 24, 2026 print, with each region's gap in cents, in percent, and converted to cents per mile at ATRI's 7.4 mpg fleet average:
| Region | Diesel $/gal | Gap vs national | Gap % | What the national table does to you |
|---|---|---|---|---|
| California | 7.040 | +1.388 | +24.6% | under-recovers $0.188/mi |
| West Coast excluding California | 5.859 | +0.207 | +3.7% | under-recovers $0.028/mi |
| Central Atlantic | 5.840 | +0.188 | +3.3% | under-recovers $0.025/mi |
| New England | 5.716 | +0.064 | +1.1% | under-recovers $0.009/mi |
| U.S. national average | 5.652 | - | - | the number your schedule reads |
| Midwest (PADD 2) | 5.636 | -0.016 | -0.3% | overpays $0.002/mi |
| Rocky Mountain (PADD 4) | 5.537 | -0.115 | -2.0% | overpays $0.016/mi |
| Gulf Coast (PADD 3) | 5.481 | -0.171 | -3.0% | overpays $0.023/mi |
| Lower Atlantic | 5.350 | -0.302 | -5.3% | overpays $0.041/mi |
The middle of that table is noise. Half a cent a mile is not a strategy. The two ends are not noise: California to Lower Atlantic is 23 cents a mile of pure index mismatch, and it persists week after week because it is structural, not weather.
At 6 mpg, which is what most bracket tables actually assume, every number in that right-hand column gets about 23 percent bigger. California becomes 23 cents a mile.
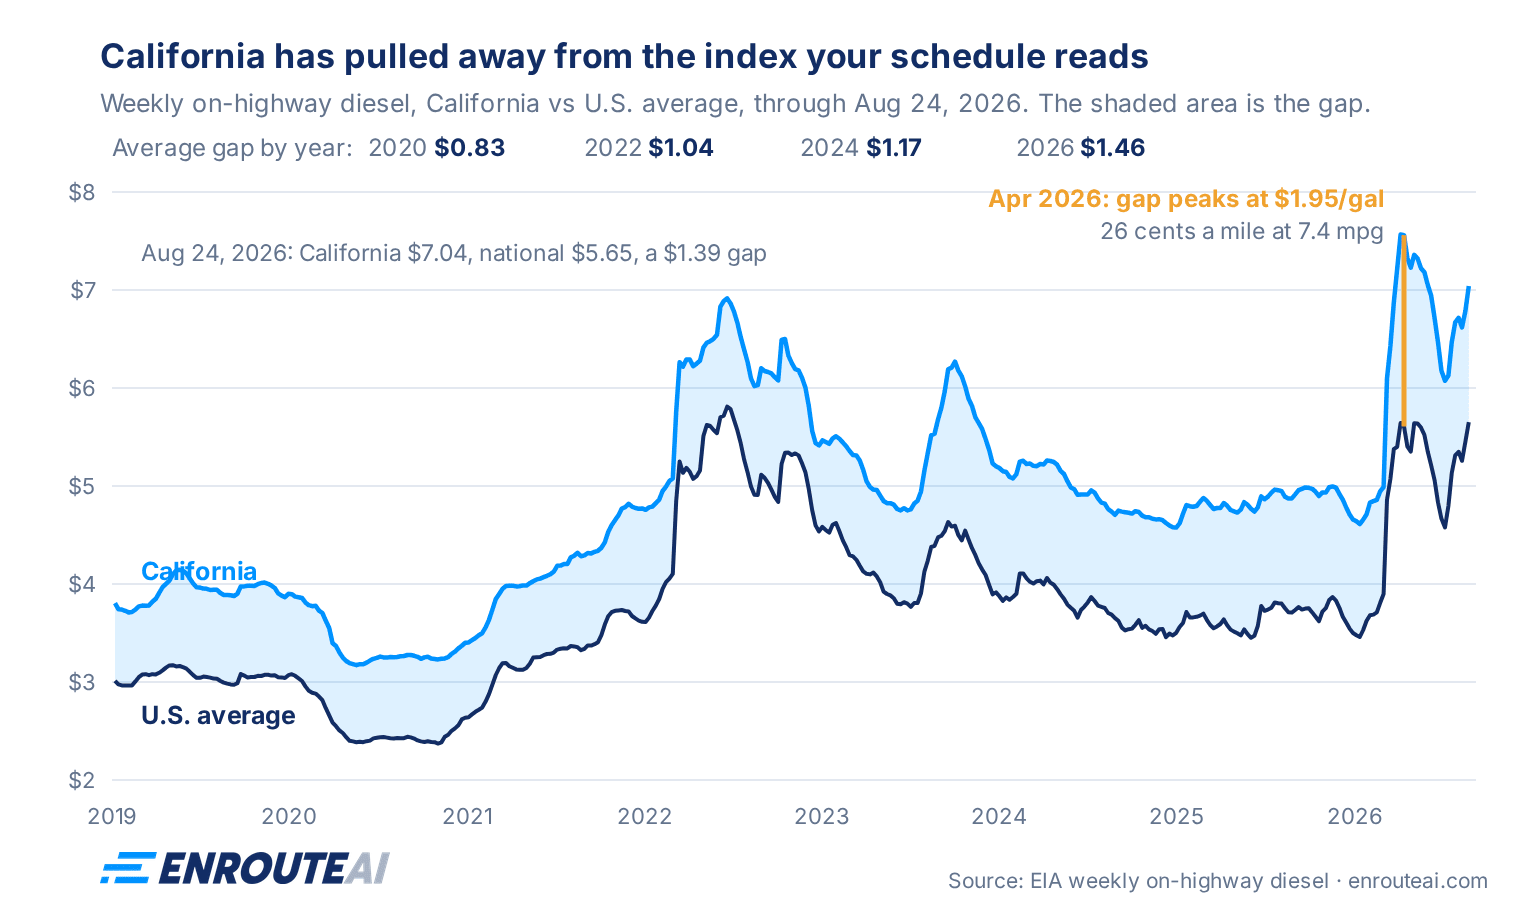
California is not drifting. It has drifted.
The California premium is not new. What has changed is the size. Average weekly gap between California and the national average, by year:
| Year | Average CA gap, $/gal | As % of the national average |
|---|---|---|
| 2020 | 0.83 | 32% |
| 2021 | 0.88 | 27% |
| 2022 | 1.04 | 21% |
| 2023 | 1.14 | 27% |
| 2024 | 1.17 | 31% |
| 2025 | 1.19 | 33% |
| 2026 year to date | 1.46 | 30% |
One line to carry out of that table: the California premium has been roughly one third above national for six years, and the cents it costs you have grown 76 percent. Both columns are true and they say different things. In percentage terms the California premium has been roughly stable for six years, somewhere between a fifth and a third above national. In cents, which is the unit your fuel surcharge actually pays in, it is up 76 percent since 2020. A schedule does not pay you percentages of a gallon. It pays cents per mile, computed from a national price that is now $1.46 below the one your California trucks are pumping.
2026 is the break in the cents column. The gap peaked at $1.95 a gallon on April 13 and has spent 14 weeks of this year above $1.50, a level it never touched in 2024 or 2025. At 7.4 mpg, a $1.95 gap is 26 cents a mile the national table cannot see.
Four structural drivers, none of which reverse quickly:
- Fuel taxes. California's state diesel excise tax is 48.2 cents a gallon for July 1, 2026 through June 30, 2027 (CDTFA), on top of the 24.4 cent federal tax everyone pays, plus diesel sales tax at 13 percent and district taxes.
- Carbon programs. Cap-and-trade and the Low Carbon Fuel Standard both add cost at the rack. Published estimates put cap-and-trade near 24 cents a gallon and LCFS around 20, and LCFS costs run higher on diesel than gasoline because diesel generates more deficits per gallon. The LCFS amendments that took effect in 2025 tightened the carbon intensity benchmark further.
- A different fuel. CARB diesel is its own specification. It is not interchangeable with the diesel refined for the rest of the country, so the state cannot be supplied out of Gulf Coast surplus the way most of the country can.
- A shrinking refinery base. Phillips 66 ended operations at its Los Angeles area (Wilmington) refinery in Q4 2025 and Valero closed Benicia in April 2026. The EIA put those two plants at about 17 percent of California refining capacity and 11 percent of West Coast capacity. A thin, isolated market with fewer refineries prices its supply shocks higher, and the 2026 gap chart shows exactly that shape.
The trucking consequence is simple. Whatever you think about the policy, the national DOE index is now describing a fuel market that a growing share of your miles does not buy from.
What it costs on a real lane
Take a 700 mile lane inside California, three loads a week, under a national bracket table.
- Your fuel cost at 7.4 mpg and California's $7.040: $0.951 a mile
- The table pays the national bracket at $5.652: $0.77 a mile
- Gap: $0.18 a mile, or $127 a load, or about $19,800 a year on that one lane
Nothing about that gap is recoverable through operations. You cannot drive it out. It is set by an index choice in a contract you signed, and it will still be there next August.
Now the version that matters for a real fleet, which never has one region. Weight each region's gap by the share of miles you actually run there:
| Region | Share of miles | Gap $/mi | Contribution |
|---|---|---|---|
| California | 40% | -0.188 | -0.075 |
| Gulf Coast | 30% | +0.023 | +0.007 |
| Midwest | 30% | +0.002 | +0.001 |
| Network | 100% | -$0.067/mi |
Just under seven cents a mile, net, structural, on every mile the fleet runs. At five million annual miles that is $337,000 a year, and it appears in no operating report because it is not a cost overrun. It is a revenue shortfall hiding inside a fuel surcharge that looks like it is doing its job.
Run the same table with your own numbers before your next bid. It takes ten minutes and it is the highest-value ten minutes in the process, because the answer changes what you submit.
Why you cannot buy your way out of it
The obvious counter is that carriers already optimize fuel purchasing, so the regional price is a purchasing problem, not a pricing problem. Partly true, and the part that is not true is the expensive part.
IFTA settles taxes by where you drive, not where you buy. Fuel your truck in Arizona and run 400 miles in California, and the fuel tax on those California miles gets apportioned to California at quarterly settlement. The tax component of the California premium follows your miles regardless of where the pump was.
The non-tax component is avoidable only if you can avoid the pump. Carbon program costs and the refining premium are embedded in the California rack price, so a truck that fuels out of state and drives through does dodge them. That works on a Phoenix to Sacramento run. It does not work on intra-California freight, long California dwell, reefer fuel bought in state, or any network where the California miles are the majority. And the deeper you go into California, the less of the tank you can bring with you.
So the answer is: buy fuel smart, and still price the residual, because it is real. (Whether a given tax or fee is avoidable in your operation is a question for your fuel tax people. The point here is only that some of the premium is unavoidable, which is enough to make it a bid-time number.)
How to price it
Three moves, in order of how likely a shipper is to say yes.
1. Ask for a regional index. The EIA publishes PADD-level averages on the same schedule as the national one, from the same survey, at no cost. A shipper whose freight is West Coast heavy and who wants carriers to stop padding can switch the schedule to the PADD 5 index without new data or new administration. Some already do. Ask, and bring the numbers above.
2. Ask for a California adder. Easier for a national shipper to accept than reindexing the whole program: standard national table everywhere, plus a defined cents-per-mile adder on miles run in California. Calibrate it as the observed gap divided by your fleet mpg, and state it as a formula so it floats, not a fixed number that is wrong in six weeks.
3. Price it into the linehaul, lane by lane. The default, because most shippers run one program. Extend the keep-whole equation from the manual with a regional term:
submit linehaul = operating target + (regional diesel price / your mpg) − shipper's FSCFor the intra-California lane: $3.00 target plus $0.951 real fuel minus $0.77 from the table gives $3.18 a mile, against the $2.99 a carrier pricing off the national average would submit. You will look 6 percent higher on that lane. You should. Every other lane in your file, in Texas and Georgia, prices two to four cents a mile lower than that carrier's, because on those lanes the national table overpays and you can afford to pass it through.
That last part is the whole point, and it is why this is a pricing edge rather than a complaint: the same schedule that under-recovers your California miles over-recovers your Gulf Coast miles. A carrier who prices the regional gap lane by lane is more competitive on cheap-diesel lanes and correctly priced on expensive ones. A carrier who prices to the national average is uniformly wrong, and in the direction that loses the good lanes and wins the bad ones.
Checklist
- Which index does the schedule name? National DOE, a PADD region, or a provider index. If it does not say, ask before you bid; the difference is worth cents a mile.
- Where do your miles actually run? Not your terminals. Your miles, by state, from last year's settlements.
- Compute your network gap. Weight each region's gap by miles share. One number, updated quarterly.
- Check the two ends. California and the West Coast on one side, Gulf Coast and the Lower Atlantic on the other. The middle regions rarely move the needle.
- Watch the trend, not the week. The California gap has grown 63 cents a gallon in six years. A three-year contract priced on today's spread is a position on that trend.
- Reefer in California is the compound case. A frozen load on an intra-California lane burns $1.20 a mile of fuel: California diesel through a 7.3 mpg tractor, plus 0.033 gallons a mile for the refrigeration unit. The national table pays $0.77. That is a 43 cent a mile gap, and both halves of it are invisible in the schedule. See the reefer post.
The closing note
One lane, one region, ten minutes of arithmetic. A national bid is 300 lanes across nine regions, each needing its own fuel gap applied against one schedule that only knows one number, due Friday. That is the shape of problem EnrouteAI exists to run: every lane priced against the bid's actual fuel program and your real cost basis, region included, so the regional gap shows up in your submitted rates instead of in next year's margin review.
A tool for this, in preview
We are building a fuel surcharge simulator that runs this arithmetic against your own schedule: enter the bracket table and your fuel economy, move the diesel price and your regional mix, and see where the program under-recovers and where it pays. It is in internal preview right now. If you want early access, ask for it here.
Sources
- EIA, weekly on-highway diesel prices, national and by region. Every price in this post comes from that series
- EIA, refinery closures on the West Coast, capacity shares for the two closed California plants
- CDTFA, diesel fuel tax rates
- CARB, Low Carbon Fuel Standard
- IFTA, how fuel taxes are apportioned across the states you run
FAQ
Why is California diesel so much more expensive than the national average?
Four reasons that stack: the highest state diesel excise tax in the country (48.2 cents a gallon for 2026-27, plus 13 percent sales tax), cap-and-trade and Low Carbon Fuel Standard costs embedded in the rack price, a unique CARB diesel specification that cannot be supplied from out-of-state surplus, and a refining base that lost roughly 17 percent of its capacity when Phillips 66 closed Wilmington in late 2025 and Valero closed Benicia in April 2026. The gap averaged 83 cents a gallon in 2020 and $1.46 in 2026 to date, and stood at $1.39, or 25 percent, on the August 24, 2026 print.
Does a fuel surcharge use a national or regional diesel price?
Almost always national. Nearly every truckload bracket table reads the EIA's weekly U.S. on-highway average. The EIA publishes regional (PADD) averages from the same survey on the same day, and a minority of shippers index to them, but you have to ask.
How much does the regional fuel gap cost per mile?
Divide the gap by your fleet's miles per gallon. On the August 24, 2026 print, at 7.4 mpg: California under-recovers 19 cents a mile against a national schedule, the Lower Atlantic over-recovers 4 cents. At the 6 mpg most bracket tables assume, California is 23 cents.
Can I avoid the California fuel premium by buying fuel elsewhere?
Partly. IFTA apportions fuel taxes to the states where you run miles, so the tax portion follows your California miles no matter where you fill up. The carbon program and refining components are in the California pump price, so a truck that fuels out of state and drives through avoids those. Intra-California freight, long dwell, and reefer fuel bought in state cannot avoid them.
Should I price California lanes differently in an RFP?
Yes, if the schedule is national. The regional gap is not an operating cost you can drive out; it is set by the index in the contract. Price it into the linehaul lane by lane, which also means your cheap-diesel lanes can be priced lower than a competitor who spreads a national average across the whole file.